
new-on-nomni
new-on-nomni
July Updates: Fresh Technology Updates from The Nomni Kitchen
July Updates: Fresh Technology Updates from The Nomni Kitchen
July Updates: Fresh Technology Updates from The Nomni Kitchen
July updates introduce new loyalty dashboards, improved Brandollar web claims on Android, and enhanced audit tracking in Nomni Supply.
July updates introduce new loyalty dashboards, improved Brandollar web claims on Android, and enhanced audit tracking in Nomni Supply.
Written by

Nomni
The ultimate hospo solution
This month, marketing and product teams gain clearer visibility into loyalty performance. With three new dashboards inside Nomni Insights, you can see who is earning, redeeming, disengaging or ready to be reactivated in one place.
Android users can now claim Brandollars without downloading an app, making redemption more accessible.
A full audit trail has also been added to your Nomni Supply Market List for improved tracking and accountability.
Three New Dashboards in Nomni Insights to Measure Loyalty, Churn and RetentionIt is Monday morning. You open your dashboard and immediately see:
With this visibility, you can identify specific gaps and opportunities, allowing your next campaign to be built on clear behavioural data. This month introduces three new dashboards inside Nomni Insights, giving marketing and product teams a consolidated view of who is earning, redeeming, disengaging and ready for reactivation. Customer Loyalty Dashboard Track what matters. Address what is underperforming. Improve the return on your loyalty program. The Customer Loyalty Dashboard consolidates loyalty data in one place. View total value earned and redeemed, identify which venues are driving engagement, and understand who your most active and least active members are. It provides a clear performance view of your loyalty program. Key Benefits
Product Highlights
Customer Accounting & Churn Dashboard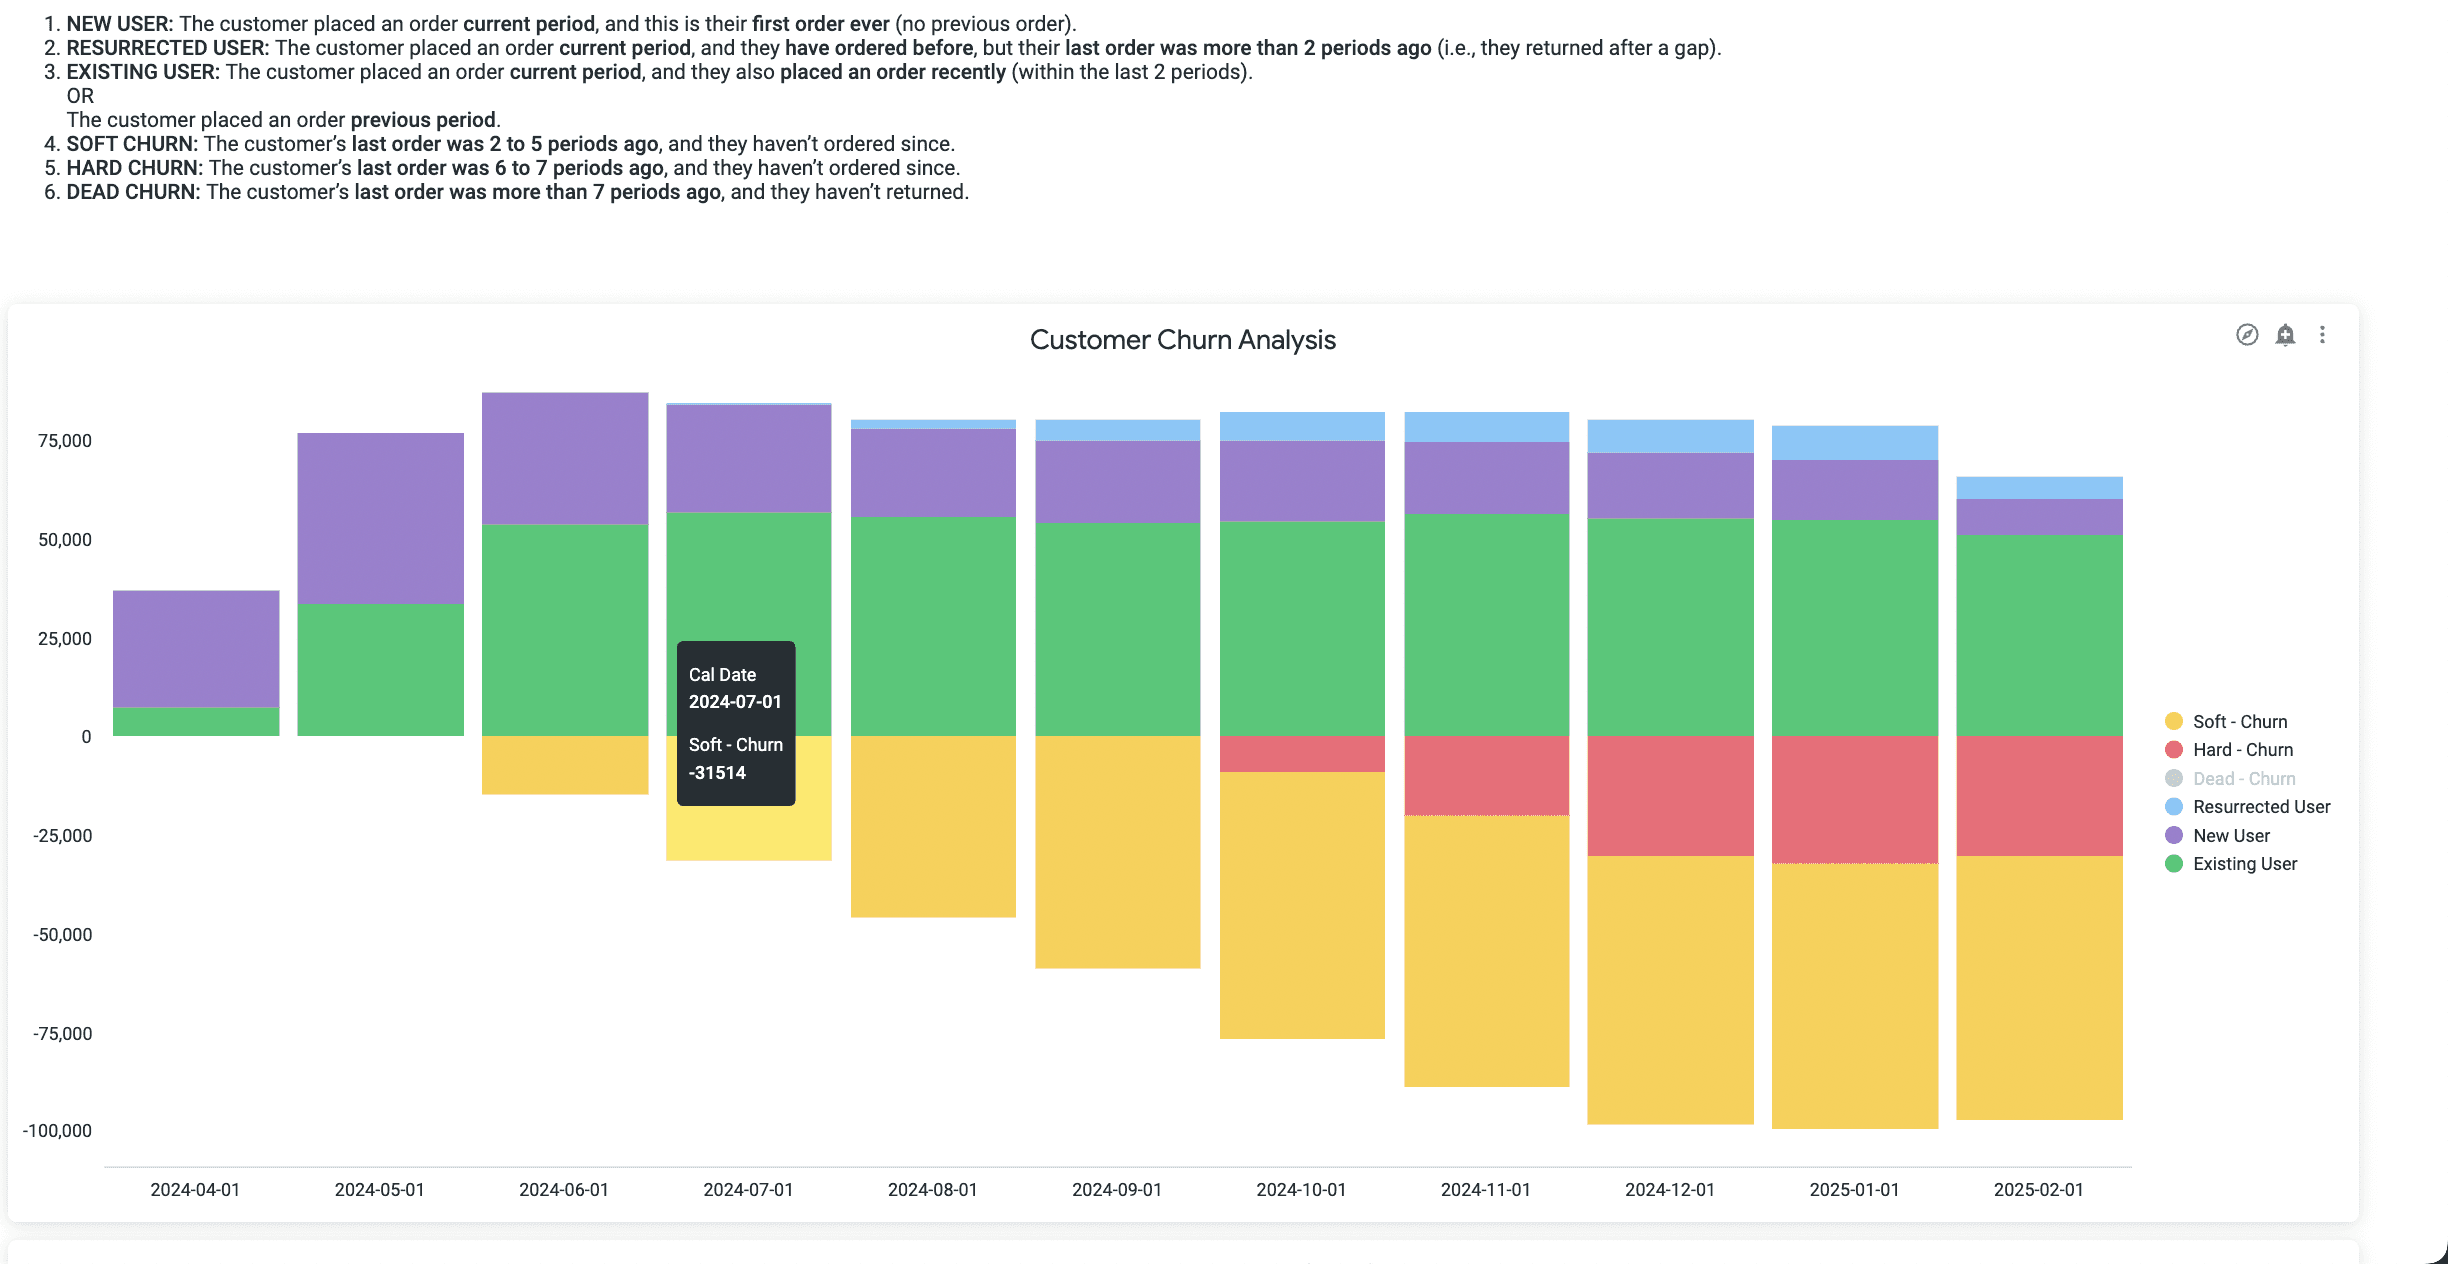 Identify churn early and re-engage customers before they disengage fully. This dashboard segments your customer base by lifecycle stage, from New to Soft Churned to Dead Churned, enabling earlier intervention. Weekly and monthly views allow you to monitor drop-offs, reactivation and long-term retention across venues, tiers and campaigns. Product Highlights
Customer Cohort Analytics DashboardLoyalty performance is measured by what happens after signup. This dashboard tracks how each month’s new customers behave over time, including return frequency, spend levels and transaction patterns. By grouping customers into monthly cohorts, you can identify which segments deliver long-term value, which decline quickly and how effectively your loyalty program drives sustained engagement. Key Benefits
Product Highlights
|
Claim Brandollars on Android—No App Needed

Brandollar campaigns were underperforming on Android when users did not have the app installed or Instant Apps enabled.
The new Web Claim fallback allows all Android users to claim their Brandollars in under 30 seconds without downloading an app. Claims are processed on page load, rewards are securely verified and users receive instant confirmation. The experience works across all Android devices.
Key Benefits
Supports all Android users regardless of app or Instant App status.
Improves claim success rates and reduces support enquiries.
Faster claims increase redemption and reduce churn.
Provides clear messaging and fallback support to build user confidence.
Product Highlights
Automatic claim using a secure token when the page loads.
Clear error messaging for expired or previously used links.
Built-in support pathway for assistance or escalation.
Rate limiting to reduce misuse.
Instant confirmation screen displaying voucher details.
Track Every Change to Your Nomni Supply Market List
Previously, there was limited visibility into who added or removed SKUs from your Market List or when suppliers discontinued items.
With the new Activity Log, every change is recorded and visible in Buyer Hub and Nomni Supply Admin. This provides a clear audit trail, helping your team manage procurement with greater confidence and accountability.
What’s Next?
We’re always looking for ways to help you serve your customers better. Stay tuned for even more exciting updates every month!
This month, marketing and product teams gain clearer visibility into loyalty performance. With three new dashboards inside Nomni Insights, you can see who is earning, redeeming, disengaging or ready to be reactivated in one place.
Android users can now claim Brandollars without downloading an app, making redemption more accessible.
A full audit trail has also been added to your Nomni Supply Market List for improved tracking and accountability.
Three New Dashboards in Nomni Insights to Measure Loyalty, Churn and RetentionIt is Monday morning. You open your dashboard and immediately see:
With this visibility, you can identify specific gaps and opportunities, allowing your next campaign to be built on clear behavioural data. This month introduces three new dashboards inside Nomni Insights, giving marketing and product teams a consolidated view of who is earning, redeeming, disengaging and ready for reactivation. Customer Loyalty DashboardTrack what matters. Address what is underperforming. Improve the return on your loyalty program. The Customer Loyalty Dashboard consolidates loyalty data in one place. View total value earned and redeemed, identify which venues are driving engagement, and understand who your most active and least active members are. It provides a clear performance view of your loyalty program. Key Benefits
Product Highlights
Customer Accounting & Churn DashboardIdentify churn early and re-engage customers before they disengage fully. This dashboard segments your customer base by lifecycle stage, from New to Soft Churned to Dead Churned, enabling earlier intervention. Weekly and monthly views allow you to monitor drop-offs, reactivation and long-term retention across venues, tiers and campaigns. Product Highlights
Customer Cohort Analytics DashboardLoyalty performance is measured by what happens after signup. This dashboard tracks how each month’s new customers behave over time, including return frequency, spend levels and transaction patterns. By grouping customers into monthly cohorts, you can identify which segments deliver long-term value, which decline quickly and how effectively your loyalty program drives sustained engagement. Key Benefits
Product Highlights
|
Claim Brandollars on Android—No App Needed
Brandollar campaigns were underperforming on Android when users did not have the app installed or Instant Apps enabled.
The new Web Claim fallback allows all Android users to claim their Brandollars in under 30 seconds without downloading an app. Claims are processed on page load, rewards are securely verified and users receive instant confirmation. The experience works across all Android devices.
Key Benefits
Supports all Android users regardless of app or Instant App status.
Improves claim success rates and reduces support enquiries.
Faster claims increase redemption and reduce churn.
Provides clear messaging and fallback support to build user confidence.
Product Highlights
Automatic claim using a secure token when the page loads.
Clear error messaging for expired or previously used links.
Built-in support pathway for assistance or escalation.
Rate limiting to reduce misuse.
Instant confirmation screen displaying voucher details.
Track Every Change to Your Nomni Supply Market List
Previously, there was limited visibility into who added or removed SKUs from your Market List or when suppliers discontinued items.
With the new Activity Log, every change is recorded and visible in Buyer Hub and Nomni Supply Admin. This provides a clear audit trail, helping your team manage procurement with greater confidence and accountability.
What’s Next?
We’re always looking for ways to help you serve your customers better. Stay tuned for even more exciting updates every month!
Nomni is the first complete hospitality system that works for you. Loved by over 35,000 venues across Asia Pacific and used by tens of millions of diners and operators annually. To see how Nomni can work for you, visit Nomni.ai
Nomni is the first complete hospitality system that works for you. Loved by over 35,000 venues across Asia Pacific and used by tens of millions of diners and operators annually. To see how Nomni can work for you, visit Nomni.ai
Share this post
Share this post
You might also like
You might also like
You might also like


Browse by category
Browse by category
End not knowing!
Get industry insights, guides, best practices from the best operators, sneak previews of new technology, and more!
End not knowing!
Get industry insights, guides, best practices from the best operators, sneak previews of new technology, and more!
End not knowing!
Get industry insights, guides, best practices from the best operators, sneak previews of new technology, and more!